Ready to get your next 10,000 subscribers?
Join thousands of creators who use Subscribr to create faster, better YouTube videos.
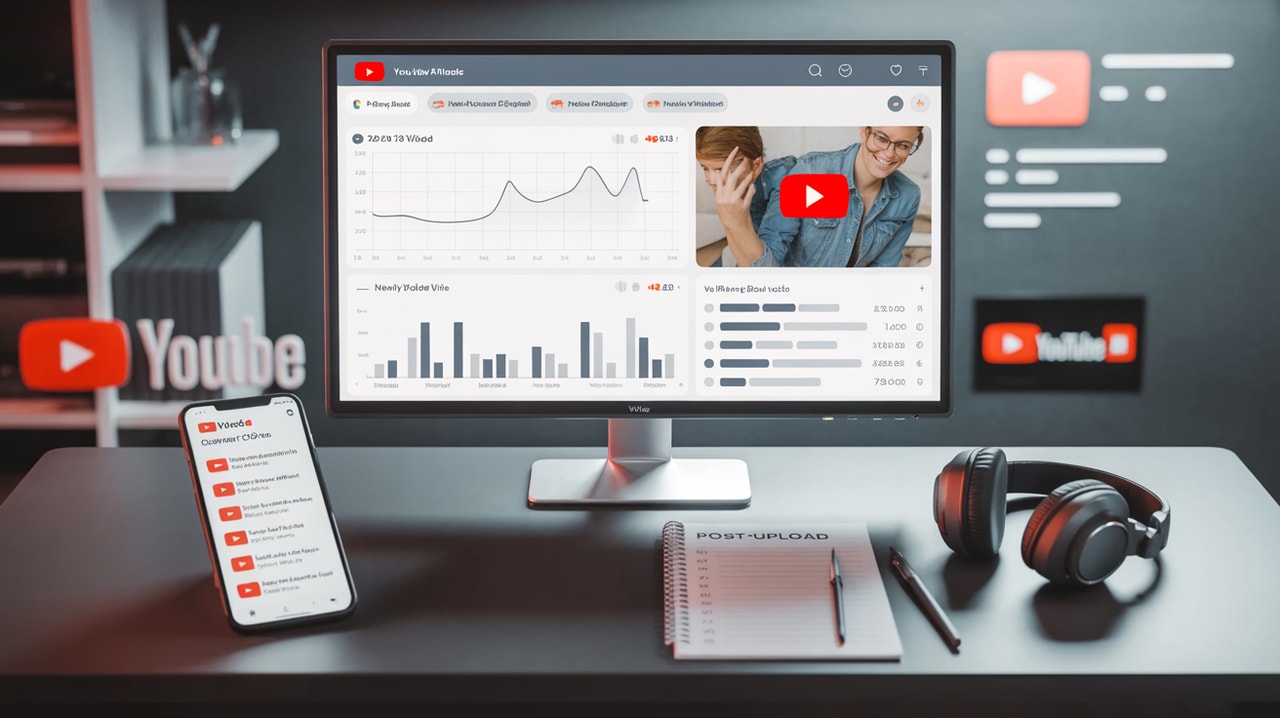
The Post-Upload Checklist: Analyzing Your New Video's First 7 Days of Data
Your video is live! You've poured hours into ideation, scripting, filming, and editing. Now comes the crucial next step: understanding how it's performing. The first 7 days after publishing are a critical window where your video interacts with the YouTube algorithm and your audience. Analyzing the data during this period isn't about getting an immediate "hit or miss" verdict, but about gathering vital feedback to inform your future content strategy and predict potential trajectory.
For many intermediate creators, the post-publish phase can feel overwhelming. YouTube Analytics is packed with data, and it's easy to get lost or misinterpret early signals. The confusion often stems from not knowing what to look for and what action to take based on those early numbers. This article provides a clear checklist to guide you through analyzing your new video's performance in its crucial first week, transforming data overload into actionable insights.
By systematically reviewing key metrics, you can identify what resonated with your audience, spot areas for improvement, and make informed decisions that can boost your video's performance trajectory and, ultimately, its earning potential.
Why the First 7 Days Matter (But Aren't the Whole Story)
The initial hours and days of a video's life are significant for YouTube's algorithm, especially as your channel grows. YouTube typically shows your new video to a subset of your subscribers first. How this initial group responds dictates whether YouTube pushes the video to a wider audience, including non-subscribers. High engagement signals (strong Click-Through Rate and Audience Retention) tell YouTube your video is worth recommending.
This early period is about velocity – how quickly your video accumulates views and watch time. Encouraging this early momentum through community notifications can be helpful. However, it's vital not to obsess over the data in the immediate moments after hitting publish. Checking analytics too soon can be misleading. Many videos that become long-term successes take weeks to gain significant traction. Think of the first 7 days as a crucial initial assessment period, not the final judgment.
Your 7-Day Post-Upload Analytics Checklist
Instead of constantly refreshing your analytics, set a specific time a couple of days after publishing (e.g., Sunday evening for a Friday upload) to dive in. Here’s a structured approach to analyzing your video's performance in the first week:
1. Initial Overview: How Does It Compare?
Start by looking at the basic overview in YouTube Studio analytics for your new video.
- Views: How many views has it accumulated? Compare this to your channel's typical performance for a video of similar topic and format at this stage.
- Relative Audience Retention & CTR: YouTube often gives you an early ranking (e.g., 1 of 10) comparing your video's initial CTR and retention to your channel's recent videos. While this is a very early signal and can change drastically, it provides a quick snapshot of how the packaging (thumbnail/title) and opening hook performed relative to your own baseline. Don't get fixated on the exact number, but note if it's significantly higher or lower than average.
Actionable Insight: A significantly lower-than-average early CTR might indicate your thumbnail or title isn't compelling enough for your audience compared to your usual. Low initial retention could point to a weak hook or intro.
2. Dive Deeper: Understanding Your Audience and How They Found You
Navigate to the 'Reach' tab in your video's analytics.
- Traffic Sources: Where are viewers coming from?
- Browse Features: Viewers seeing your video on the YouTube homepage, subscription feed, or "watch later" list. High browse traffic often indicates YouTube is recommending your video widely.
- YouTube Search: Viewers finding your video through search queries. This tells you how well your video is discoverable for specific terms.
- Suggested Videos: Viewers watching your video after watching another video. This is a powerful source for growth and indicates YouTube is associating your content with similar popular videos.
- External: Traffic from outside YouTube (social media, websites).
Actionable Insight: Strong performance from YouTube Search and Suggested Videos in the first week is a positive sign for discoverability. If external traffic is high, identify which platforms are sending the most viewers and consider promoting there more effectively in the future. Subscribr's Intel feature can help you analyze competitor traffic sources for similar content.
- Impressions & Click-Through Rate (CTR): Impressions are how many times your video's thumbnail was shown to viewers on YouTube. CTR is the percentage of those impressions that resulted in a click.
- Aim for a CTR that is healthy for your niche. What's good varies widely. Generally, a CTR between 4-8% is considered decent, but high-performing videos often have much higher CTRs.
- Look at the trend over the first 7 days. Did CTR start high and drop, or is it holding steady?
Actionable Insight: High impressions paired with a low CTR mean your thumbnail/title isn't enticing viewers to click, despite being shown widely. High impressions and a high CTR indicate effective packaging that's resonating with your target audience. Consider A/B testing thumbnails on future videos if CTR is consistently low.
3. The Core Metric: Audience Retention
Go to the 'Audience' or 'Engagement' tab to analyze Audience Retention. This is one of the most critical metrics for the YouTube algorithm.
- Average View Duration & Average Percentage Viewed: These numbers give you a quick summary of how long, on average, viewers are watching.
- Audience Retention Graph (The Attention Curve): This graph is gold. It shows the percentage of viewers still watching at every moment of your video.
- First 30 Seconds: Pay close attention to the drop-off in the very beginning. A steep drop here (e.g., 80% leaving) indicates a problem with your hook, intro, or perhaps viewer expectations set by the thumbnail/title.
- Significant Dips: Identify points in the video where there are large drops in retention. Watch your video alongside the graph to understand what was happening at that exact moment. Was it a long, boring section? A confusing explanation? Technical issues? A weak call-to-action?
- "Peaks" or Spikes: Sometimes, you'll see small bumps in retention. This might indicate viewers re-watching a specific part.
- Ending Retention: How many viewers make it to the end? A strong ending retention suggests your video held attention throughout.
Actionable Insight: Analyze the attention curve to pinpoint exactly where viewers are dropping off. This is invaluable feedback for improving the pacing, editing, and structure of future videos. If your intro is consistently weak, focus on refining your hooks. If a specific type of content segment causes drops, rethink how you present that information. Subscribr's Video Breakdown Tool can help analyze successful videos in your niche to see how they structure content and maintain viewer attention.
- New vs. Returning Viewers Retention: In the 'See More' analytics, you can often split retention data by new and returning viewers.
Actionable Insight: This split is crucial. If new viewers drop off much faster than returning viewers, it might mean your video assumes too much prior knowledge, uses inside jokes they don't understand, or your pacing is off-putting to someone unfamiliar with your style. If returning viewers are dropping off, perhaps your content is becoming repetitive or not meeting their evolving expectations.
4. Engagement Signals: Likes, Comments, and Shares
Look at the 'Engagement' tab for these metrics.
- Likes & Dislikes: While less algorithmically impactful than watch time, likes and dislikes provide feedback on viewer sentiment. A high like ratio is generally positive.
- Comments: Read through comments. What questions are viewers asking? What feedback are they giving? Are they expressing confusion or appreciation? Comments are direct qualitative feedback.
- Shares: How many times was your video shared? Shares indicate viewers found the content valuable enough to pass on.
Actionable Insight: High engagement (likes, comments, shares) signals to YouTube that viewers are interacting with your content, not just passively watching. Respond to comments to build community and gather more insights. Look for patterns in comments – are people asking for more on a specific topic?
5. Subscriber Growth
Check the 'Audience' tab for subscriber data.
- Subscribers Gained/Lost: How many subscribers did this video bring in during the first week?
Actionable Insight: A video that brings in a significant number of new subscribers is likely resonating with viewers who are new to your channel and compelling them to subscribe. This is a strong indicator that the topic, format, and call-to-action were effective for audience growth.
6. Predicting Potential & Making Adjustments
Based on the data gathered in the first 7 days, you can start to form a picture of your video's potential trajectory and identify immediate learning opportunities.
- Early Indicators of Potential: Videos with strong early CTR, high audience retention (especially the first 30 seconds and overall average), and positive engagement signals are more likely to be picked up and recommended by YouTube over time. Strong performance from Search and Suggested traffic sources is also a great sign for long-term discoverability.
- Identifying What Worked (or Didn't): Compare the metrics of this video to others you've published. Did a different thumbnail style lead to a higher CTR? Did cutting down the intro improve initial retention? Did a specific topic or format resonate more with your audience? Analyze videos that outperformed your channel average (these are your 'outliers') to find patterns you can replicate. Subscribr's Channel Intelligence can help identify these outliers automatically.
- Learning from Errors: Videos with weaker early performance, particularly low retention or CTR, offer crucial lessons. Don't view them as failures, but as data points. Analyze the specific moments viewers dropped off or why they didn't click. Use these insights to refine your scripting, editing, packaging, and topic selection for future videos.
- Monetization Angle: A video that performs well in the first 7 days is building momentum that can lead to sustained views and watch time, directly impacting potential ad revenue and other monetization opportunities. Analyzing early data and making strategic adjustments to future content based on these insights is a key way to improve your channel's overall earning potential.
Leveraging Tools for Deeper Analysis
While YouTube Studio provides the raw data, platforms like Subscribr offer advanced tools to help you interpret it more effectively and connect analytics to your content creation workflow. Subscribr's Intel feature synthesizes channel and video performance data, helping you identify top-performing content and understand why it worked. The Research Assistant and Video Breakdown tools allow you to analyze successful videos (your own and others') to deconstruct their structure and engagement tactics, directly informing your scriptwriting and editing process.
Conclusion
Analyzing your YouTube video's performance in the first 7 days is not just a reporting task; it's a fundamental part of your content strategy. By moving beyond feeling overwhelmed by data and following a clear checklist focusing on key metrics like CTR, Audience Retention, and Traffic Sources, you gain actionable insights.
Use this early data to understand what resonated with your audience, identify specific moments where viewers disengaged, and learn what packaging elements drove clicks. This feedback loop is essential for predicting future video success potential and continuously refining your approach. Don't let the data sit idle; use it to make smarter decisions about your next video's topic, script, editing, and packaging. Consistent analysis and adaptation based on real performance data are hallmarks of successful intermediate creators on their path to growth.


