
Ready to get your next 10,000 subscribers?
Join thousands of creators who use Subscribr to create faster, better YouTube videos.

Stop Guessing: How to Use Audience Retention Graphs to Make Better Videos
Are you tired of uploading videos and hoping for the best, only to see inconsistent performance? Do you struggle to understand why some videos take off while others fall flat? You're not alone. Many creators find themselves staring at YouTube Analytics, feeling overwhelmed by the data and unsure how to translate it into tangible improvements.
Specifically, understanding Audience Retention can feel like trying to read a foreign language. You see the graph, but how do you actually use it to stop viewers from clicking away and keep them hooked until the end?
This is where mastering Audience Retention graphs becomes your superpower. It's not just a vanity metric; it's a direct line into the minds of your viewers, showing you exactly what captivates them and what causes them to lose interest. By learning to decode these graphs and the "Key Moments" they highlight, you can make data-driven decisions that dramatically improve your video performance, boost watch time, and ultimately, increase your monetization potential.
This guide will walk you through how to analyze Audience Retention graphs, identify critical "Key Moments," and use these insights to refine your content strategy, editing, and pacing, transforming your analytics from confusing numbers into your most valuable growth tool.
What is Audience Retention and Why Does it Matter?
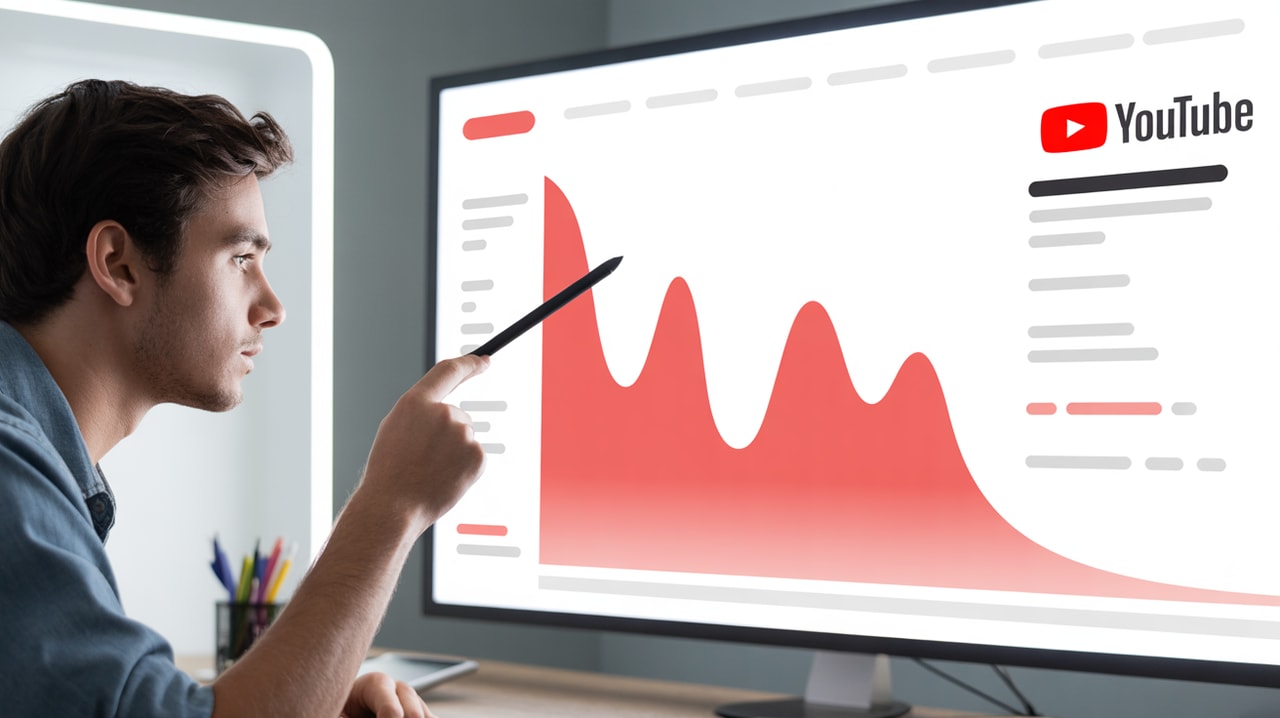
Audience Retention is a YouTube Analytics metric that shows the percentage of viewers who watch your video at each moment. It's typically displayed as a graph, with the percentage of viewers on the vertical axis and the video's timeline on the horizontal axis.
Why is this metric so crucial? Because YouTube's algorithm heavily favors videos that keep viewers watching for longer periods. High audience retention signals to YouTube that your content is engaging and satisfying to viewers, making it more likely to be recommended to others. This creates a powerful cycle: better retention leads to more watch time, which leads to more recommendations, and ultimately, more views and subscribers.
For intermediate creators looking to move beyond basic video creation, understanding and optimizing for audience retention is a key performance optimization strategy. It directly impacts your channel's growth velocity and monetization potential.
Decoding the Audience Retention Graph
The Audience Retention graph isn't just a single line; it's a story told in data points. Here's how to start reading it:
- The Overall Shape: A steep, consistent downward slope indicates viewers are dropping off quickly throughout the video. A flatter line, especially in the middle sections, suggests viewers are staying engaged.
- The First 30 Seconds: Pay close attention to the initial drop-off in the first 15-30 seconds. This is a critical window where viewers decide if they'll stick around. A sharp drop here means your hook isn't effective.
- Average Percentage Viewed: This number tells you, on average, what percentage of your video viewers are watching. While this varies by video length and niche, aiming for over 50% is generally a good goal, and an average view duration of 7-9 minutes or higher is a strong indicator of engagement.
- Comparing to Typical Performance: YouTube Analytics often shows your video's retention line against a gray band representing the typical retention range for your channel or similar videos. Aim for your video's line to stay above this typical range.
By regularly reviewing this graph for each video, you can start to see patterns in viewer behavior across your content.
Identifying "Key Moments for Audience Retention"
Beyond the overall shape, YouTube highlights specific "Key Moments" on your retention graph that offer even deeper insights:
- Intro: This shows the percentage of viewers still watching after the first 30 seconds. A strong intro keeps this number high.
- Spikes: These are points where the graph unexpectedly jumps upwards. Spikes can indicate moments viewers are rewatching – perhaps they missed something, found a section particularly interesting, or are using chapters to navigate back to a specific point. Analyzing what happened during these spikes can reveal what truly resonates with your audience.
- Dips: These are significant downward slopes where a large percentage of viewers are leaving. Dips are goldmines for identifying what isn't working. What happened at that exact timestamp? Was there a slow segment, a confusing explanation, a jarring transition, or perhaps an overly long self-promotion?
- End Screen: This metric shows the percentage of viewers who made it to your end screen. A high number here indicates viewers are watching your videos until the very end, which is excellent for overall watch time and encouraging them to watch another video.
Analyzing these key moments is a crucial data interpretation and understanding metrics step for any creator serious about growth.
How to Use Audience Retention Data to Improve Your Videos
Now for the actionable part: translating these insights into a better content strategy and improved video performance.
1. Optimize Your Intro (The First 30 Seconds)
The initial drop-off is often the steepest. Use your retention data to diagnose why:
- Analyze Your Hooks: Look at videos with high retention in the first 30 seconds. What was your hook? Did you immediately address the viewer's problem or curiosity? Did you show a compelling visual?
- Ruthlessly Edit: Eliminate any unnecessary intros, lengthy channel branding, or slow lead-ins. Get straight to the value proposition of your video.
- Test Different Hooks: Experiment with different types of hooks – asking a question, showing a surprising result, or presenting a compelling problem – and see which ones result in higher initial retention.
2. Pinpoint and Fix Drop-Off Points
Dips in the graph highlight exactly where viewers are losing interest. Investigate these moments:
- Watch the Video at the Timestamp: Go to the exact timestamp where a significant dip occurs and watch that section of your video.
- Ask "Why?": What was happening visually and audibly? Was the pacing too slow? Was the topic uninteresting or confusing? Was there a technical issue? Did you include an intrusive verbal call to action that prompted viewers to click off?
- Identify Patterns: Do similar dips occur in multiple videos around the same point (e.g., always during the explanation of a specific concept, or right after your intro)? This indicates a recurring issue in your content format or delivery.
- Implement Changes: Based on your analysis, make specific changes in future videos. This could involve:
- Cutting or shortening slow segments.
- Improving your explanations or adding visuals to clarify complex points.
- Varying your pacing.
- Using less intrusive on-screen graphics for calls to action instead of verbal interruptions.
- Ensuring smooth transitions between topics.
3. Learn From Spikes and High Retention Segments
Spikes and consistently flat, high sections of the graph show you what's working.
- Analyze Engaging Moments: Watch the parts of your video that have spikes or high retention. What made these moments stand out? Was it a particularly interesting piece of information, a compelling visual (this is where B-roll matters!), a moment of humor, or a change in energy?
- Replicate Success: Identify the elements that contributed to these engaging moments and intentionally incorporate similar strategies into your future videos. If viewers loved a specific type of visual demonstration, plan to include more of those. If a particular storytelling technique kept them hooked, use it again.
4. Master "Key Moments" for Strategic Improvement
Using the "Key Moments" data allows for targeted improvements:
- Intro: Focus on making the first 30 seconds as compelling as possible.
- Spikes: Analyze why viewers are rewatching and use that knowledge to inform your content structure and highlights.
- Dips: This is your primary tool for identifying what to cut or improve in future content.
- End Screen: If few people are reaching your end screen, it means you're losing viewers too early. Focus on improving retention throughout the main body of the video.
5. Integrate Analytics into Your Workflow
Analyzing audience retention shouldn't be a one-off task. Make it a consistent part of your content creation process. Just as you plan, shoot, and edit, add a "Review Analytics" step. What gets measured gets improved. Regularly revisiting this data allows you to continually adapt your strategy based on real viewer behavior.
Audience Retention and Monetization
Higher audience retention directly contributes to increased watch time. Watch time is not only a critical factor for the YouTube algorithm but also directly impacts your channel's monetization potential. More watch time means more ad impressions and potentially higher earnings. By optimizing your videos using audience retention data, you are not just improving your content; you are directly boosting your ability to earn revenue from your channel.
Using Tools to Enhance Your Analytics Strategy
While YouTube Analytics provides the raw data, platforms like Subscribr can help you translate that data into actionable content creation strategies. Subscribr's Intel feature and Research Agents can assist in analyzing what's working in your niche and identifying proven formulas. By combining your understanding of Audience Retention graphs with tools that provide deeper competitive analysis and content insights, you can refine your approach and create videos that are not only engaging but also strategically optimized for growth.
Conclusion
Mastering YouTube Audience Retention graphs is a fundamental skill for intermediate creators looking to improve their video performance and grow their channels. It's about moving beyond guesswork and using real viewer data to understand what resonates with your audience and what causes them to click away.
By paying close attention to the overall shape of your retention graphs, analyzing "Key Moments" like spikes and dips, and consistently integrating this analysis into your workflow, you can make data-driven decisions that lead to more engaging content, higher watch time, increased algorithm favor, and ultimately, greater monetization success. Stop guessing and start using your analytics to build a stronger, more successful YouTube channel.